What geospatial data is, in plain terms
Geospatial data is any information that has a location attached to it. The boundaries of a watershed, the GPS coordinates of every shelter your non-profit operates, the demographic makeup of each postal code in your service area, the location of every member of your association. If a piece of data has a where component, it's geospatial.
Geospatial services are the work of collecting, cleaning, analysing, displaying, and publishing that data so it actually means something to the people who need to act on it. That can be your board, your funders, your members, the public, the government you're reporting to, or your own staff making decisions about where to focus next.
This guide is for non-profit and association leaders who've been told we need a geospatial project and want to understand what they're actually buying before signing a contract.
What non-profits actually use geospatial data for
After two decades of building this for Canadian organisations, the patterns are clear. Real non-profit use cases look like this:
Service mapping. Where do we operate? Where do our members live? Where are the gaps between need and access? A national health charity we work with uses geospatial mapping to plan where its next program office should open, based on disease prevalence, transit access, and demographic data combined.
Impact reporting. Funders increasingly want to see impact on a map. We helped 12,000 people lands differently when you can show those 12,000 people distributed across 73 communities, with intensity in regions the funder cares about.
Advocacy and campaigns. Showing where a policy gap exists, where a proposed development would cause harm, where Indigenous treaty land overlaps with current land use proposals. Geography is a persuasion tool, not just an analysis tool.
Member and donor analysis. Where are your donors actually based? Which postal codes give the most per capita? Where could a regional chapter be viable? Geospatial analysis of CRM data answers these questions in hours, not weeks.
Public-facing tools. Searchable maps of services, programs, locations, or events. Not the most glamorous use case but often the highest-impact one because real people use it to find help.
Research publication. Conservation organisations, environmental research bodies, and health research non-profits publish a lot of geographic findings. A polished, accessible web publication of that research often outperforms a PDF report no one reads.
The five buckets of geospatial work
Most projects fall into one of these. The bucket matters because it changes who you hire and how much you spend.
| Bucket | What it is | Typical cost range |
|---|---|---|
| Data collection | Going into the field with GPS units, drones, or sensors and gathering location data that didn't exist before | $5,000 to $50,000+ CAD |
| Data analysis | Taking existing data and running spatial queries, modelling, demographic enrichment, or pattern detection on it | $3,000 to $25,000 CAD |
| Internal tools | Dashboards, internal portals, mapping apps that your staff and board use | $8,000 to $40,000 CAD |
| Public publications | Story maps, web maps, public dashboards meant for outside audiences | $12,000 to $60,000 CAD |
| Ongoing support | Maintenance, data updates, hosting, occasional new analysis | $400 to $2,000 CAD/month |
A common pattern for mid-sized Canadian non-profits is to budget $20,000 to $40,000 for an initial project that combines analysis and one public-facing output, then $500 to $1,000/month for ongoing maintenance. Anything significantly cheaper usually means something is being cut.
What to look for in a vendor
Some honest signals that separate a real geospatial agency from someone who watched a tutorial:
They ask about your data before quoting. Geospatial projects live or die on data quality. A vendor who quotes without seeing your data is quoting a number, not a project. Run.
They can explain the difference between ArcGIS, Mapbox, and Leaflet without checking notes. These are the three platforms most projects use. A vendor who hasn't worked with at least two of them is too narrow.
They've shipped accessible web maps. Interactive maps are notoriously difficult to make accessible. If the vendor's portfolio is all visual flash and no WCAG conformance, they'll deliver something that fails accessibility audits and excludes screen-reader users. For Ontario non-profits specifically, this matters for AODA compliance.
They have Canadian data residency answers. Where will your data be hosted? Where will the maps be served from? For non-profits handling member or donor data, the answer should be Canadian infrastructure unless you've consciously decided otherwise. A vendor who doesn't know is a vendor who hasn't thought about it.
They show you boring outputs alongside flashy ones. The flashy story map is what gets shown at conferences. The boring internal tool is what actually saves your staff 20 hours a week. A vendor who can only show flash hasn't done enough real work.
They talk about long-term ownership. What happens when the contract ends? Can your team maintain it? Can you switch vendors? If the answer is we lock you in, walk away.
Common mistakes that waste money
We see the same five mistakes over and over:
1. Buying technology before defining the question. We need a GIS platform is not a project. We need to know whether opening a Halifax office would reach more underserved clients than expanding our Toronto presence is a project. Define the question, then pick the tools.
2. Trying to do everything in one project. Phase the work. A first project that delivers one solid analysis and one public-facing output will teach your organisation what it actually wants from phase two. Trying to deliver service mapping, donor analysis, impact reporting, and a public dashboard in a single project produces something mediocre at all of them.
3. Skipping the data audit. Half the geospatial projects that go over budget go over because the data was worse than the client said it was. Pay for the audit. It's the cheapest insurance you'll buy.
4. Hiring a generalist agency for specialist work. Many full-service digital agencies will accept a geospatial brief and figure it out as they go. The result is usually a Google Maps embed with some pins on it, delivered as if it were sophisticated. If the work is geographically meaningful, hire someone who actually does this.
5. Forgetting the maintenance budget. Geospatial outputs age. Data refreshes are needed. Map tiles change. Browser standards shift. The project that costs $30,000 to build also costs $500 to $1,500/month to keep working properly. Plan for that or the project will quietly degrade.
What geospatial technology actually refers to
When you hear geospatial technology in a vendor proposal, it usually means some combination of:
- GIS software (ArcGIS Pro, QGIS, GRASS) for desktop analysis
- Web mapping platforms (Mapbox, MapLibre, Leaflet, ArcGIS Online) for online display
- Geocoding services (Mapbox, Google, OpenCage, federal Canadian geocoders) for turning addresses into coordinates
- Spatial databases (PostGIS, SpatiaLite) for storing and querying location data at scale
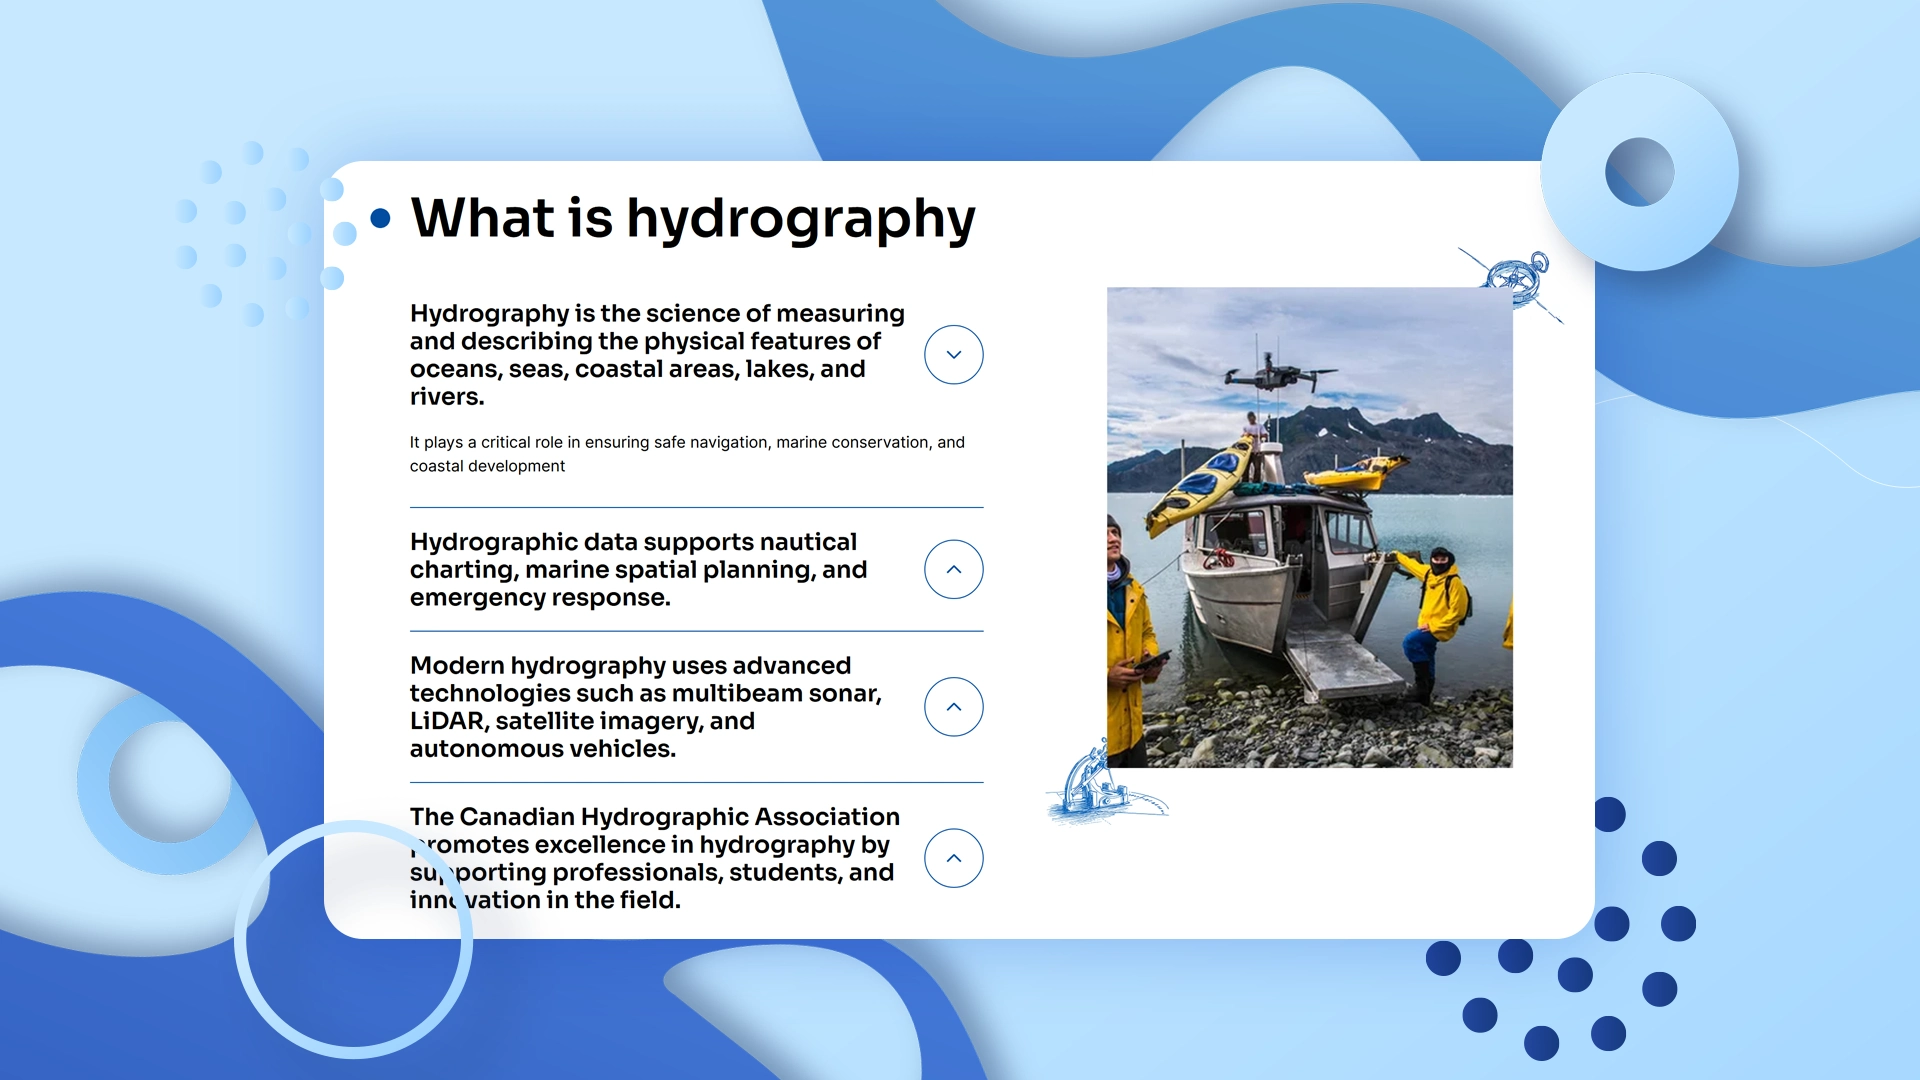
- Drone, satellite, or LiDAR data sources for collecting new imagery
- Demographic enrichment services (Statistics Canada, Esri demographics) for layering census and economic data over your maps
A serious agency will pick the right combination for the project. A less-serious one will use whichever tool they happen to know.
How to scope a first project
If you're at the very start, the cheapest useful first step is a half-day discovery session with a vendor where you map out:
- What question does your organisation need answered?
- What data do you already have that touches on it?
- Who is the audience for the answer (board, staff, public, funders)?
- What does success look like in 12 months?
Most reputable agencies will do this for $500 to $1,500 and produce a scoping document you can use whether you hire them or not. We do this as a fixed-fee engagement so the document is genuinely useful even if the client doesn't continue with us.
Pragmatica builds geospatial data tools, web maps, and story maps for Canadian non-profits. See our GIS and mapping services or get in touch for a scoping conversation.